Stock Analysis v1
This Python-based project performs sentiment analysis to investigate the correlation between global events and stock market performance. It comprises a four-stage pipeline: collecting and processing 20 years of historical stock data and daily global events (from GDELT); analyzing event headlines to assign sentiment scores to individual words based on concurrent stock price changes; and finally, offering tools to analyze these sentiment scores and predict potential stock movements based on current day's news.
Features
- Collects 20 years of daily historical stock data via Yahoo Finance for a defined list of tickers.
- Calculates daily net percentage gain/loss for each stock.
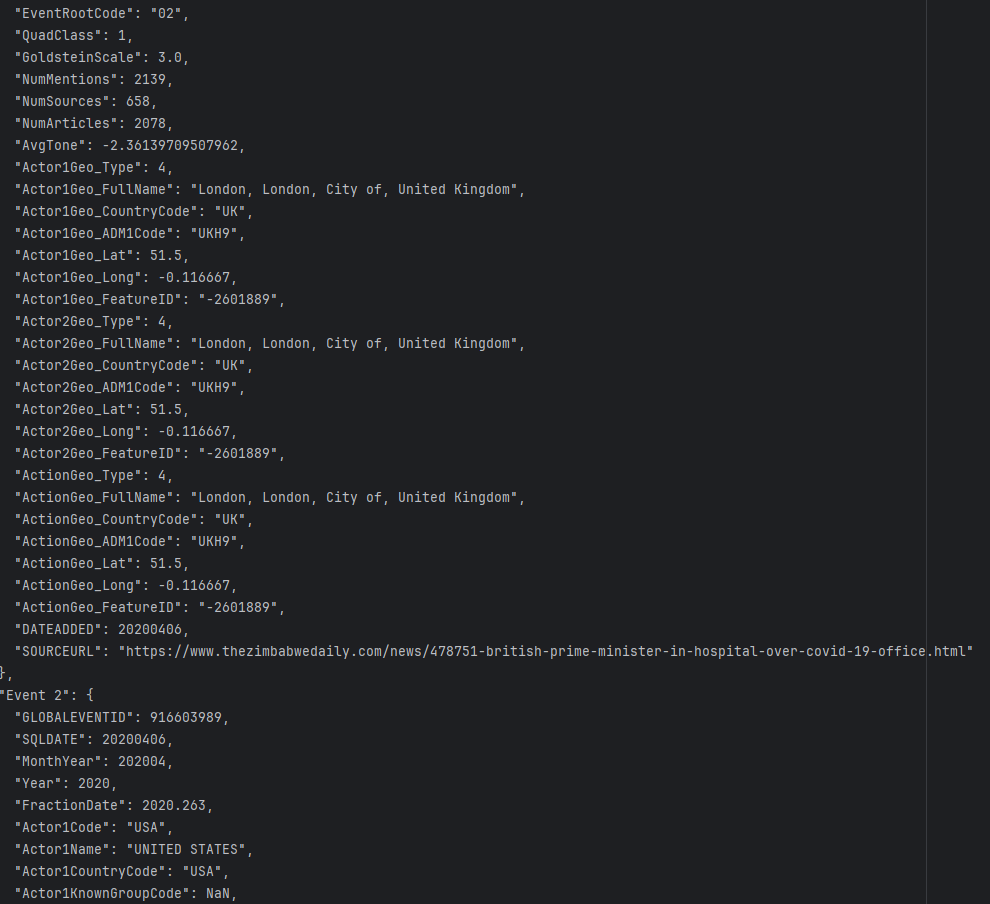
- Retrieves the top 10 global events daily from the GDELT Event Database for the past 20 years.
- Extracts potential headlines from event URLs (post-April 2013 data).
- Correlates words from event headlines with daily stock performance.
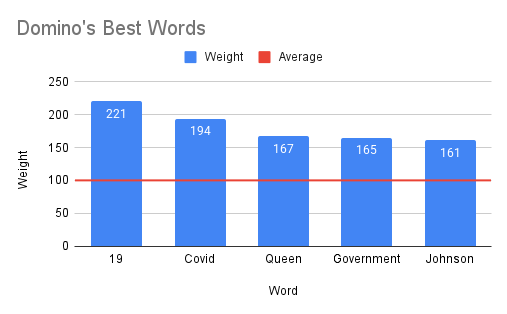
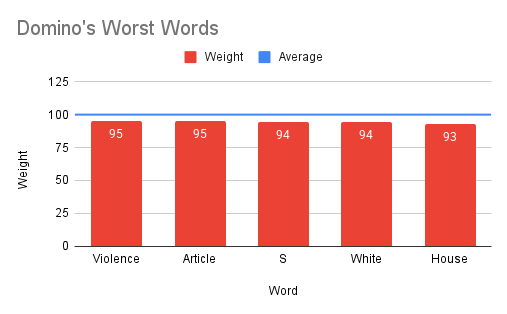
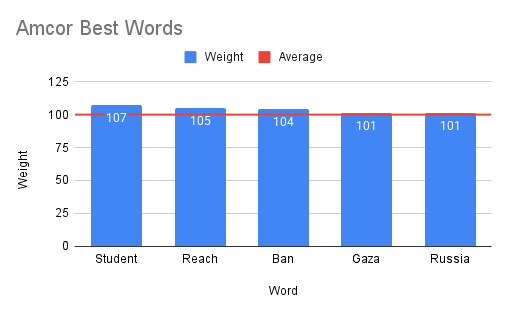
- Assigns a sentiment score to each word based on its association with stock price changes.
- Generates a stock-specific sentiment lexicon, mapping words to their impact scores.
- Identifies stocks exhibiting the largest sentiment score variance between positive and negative words.
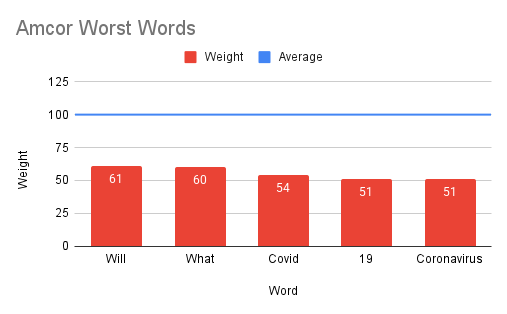
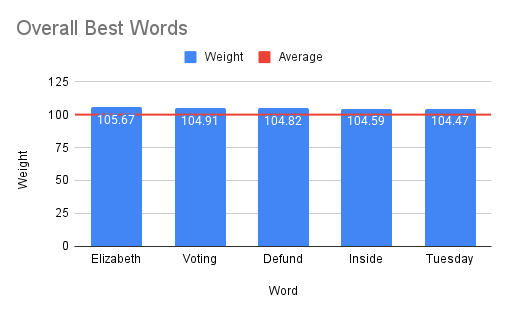
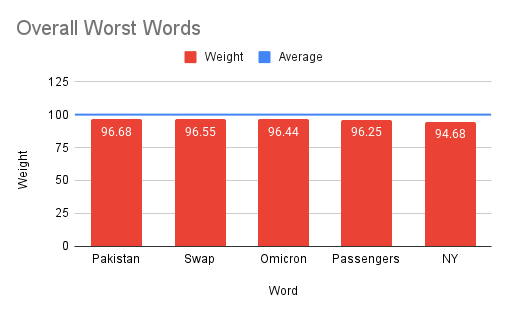
- Determines the overall "best" (most positive) and "worst" (most negative) sentiment words across all stocks.
- Predicts potential daily stock movements by analyzing current event headlines against the generated sentiment lexicon.
- Modular design using four distinct Python scripts executed sequentially.
Gallery
Technical Details
The project operates through a sequence of four Python scripts. collect_stock_data.py uses the yfinance library to download two decades of daily stock data for tickers specified in "Stock Information.csv," then calculates daily percentage changes. collect_event_data.py fetches daily top 10 events from the GDELT database over the same period, attempting to extract headlines from URLs in newer entries. stock_and_event_analysis.py merges these datasets, associating words from event headlines with the daily percentage change of each stock, thereby generating a sentiment score for each word relative to each stock. This output details how words historically correlated with stock increases or decreases. Finally, data_analysis.py allows users to query this sentiment data: to find stocks with high word-sentiment divergence, identify globally strong positive/negative words, or analyze current day's GDELT events to predict stock performance based on the learned sentiment scores.